

The Ugly Table That Prints Money
A Marketing Vandals Field Guide to Media Libraries — Part III


A while ago we had two videos live in the same campaign.
Same offer.
Same platform.
Same creator, same vibe.
One was quietly printing money.
The other was quietly burning it.
We did the usual ritual:
Checked comments
Blamed “learning phase”
Invented platform conspiracy theories
But if you opened our media library, both files looked identical apart from a random suffix.
From inside the ad account, they were just two more tiles in the grid.
The real problem wasn’t the ads.
The problem was this:
Our creative library was a museum, not a database.
We were “rich” in assets and completely broke in insight.
That’s the day Marketing Vandals stopped treating creatives as files…
and started treating them as rows in a table.
Folders Are for Storage. Tables Are for Learning.
Most teams still live in folders:
Campaign subfolders
Date subfolders
Filenames written by an editor on 2 hours of sleep
That system is fine for one question:
“Where did we put that video?”
But it fails on the questions that actually move performance:
“Which kind of opening shot keeps winning?”
“Which hooks die in week 1 every single time?”
“What works for students but flops with founders?”
You don’t answer those in Drive.
You answer them in a table.
At Marketing Vandals, the mental shift was simple:
Every creative = one row
Every trait that might matter = a column
Performance data = another table we can join in
The asset is still a file.
But the value lives in the row.
The Marketing Vandals Tables (a.k.a. Our Creative Brain)
We run on two main tables:
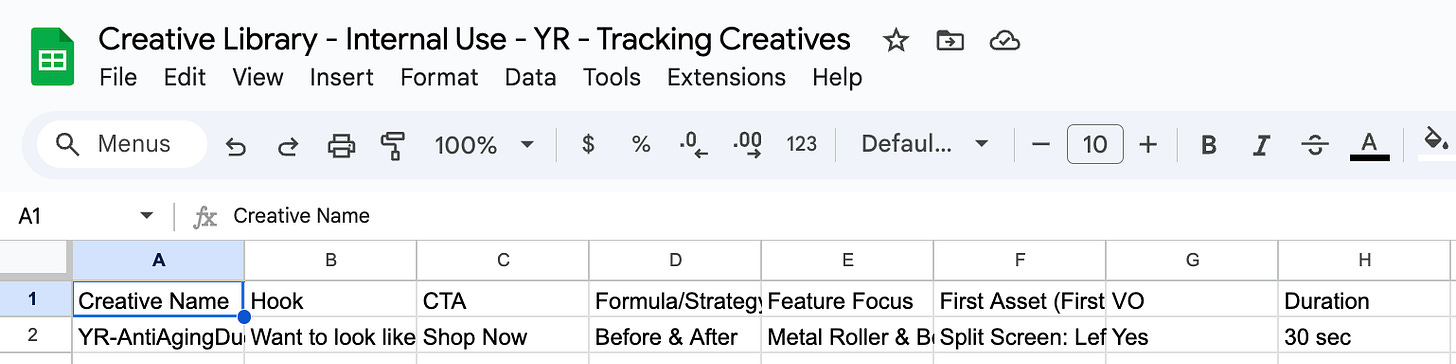
The Creative Table – everything about what the asset is
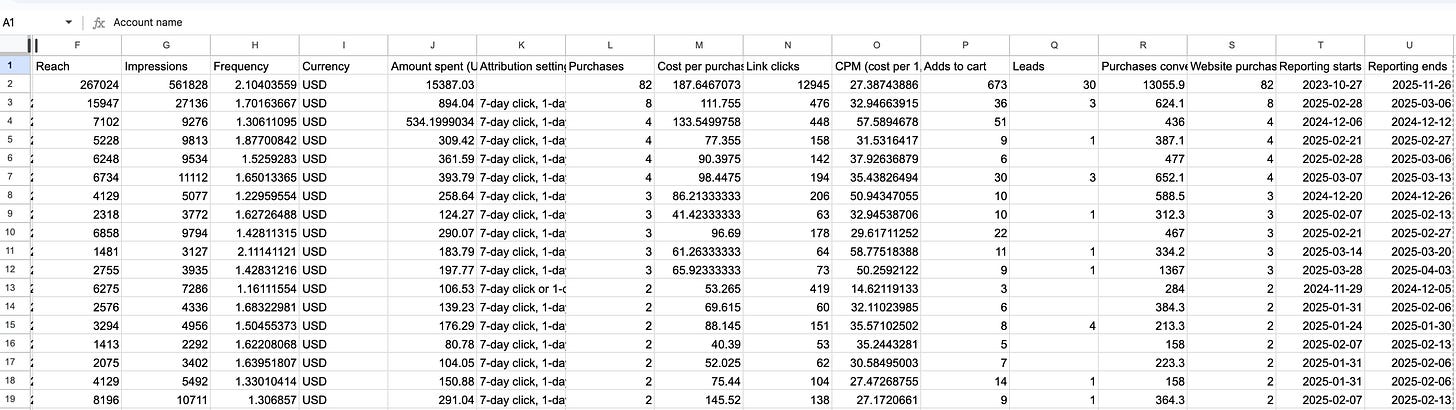
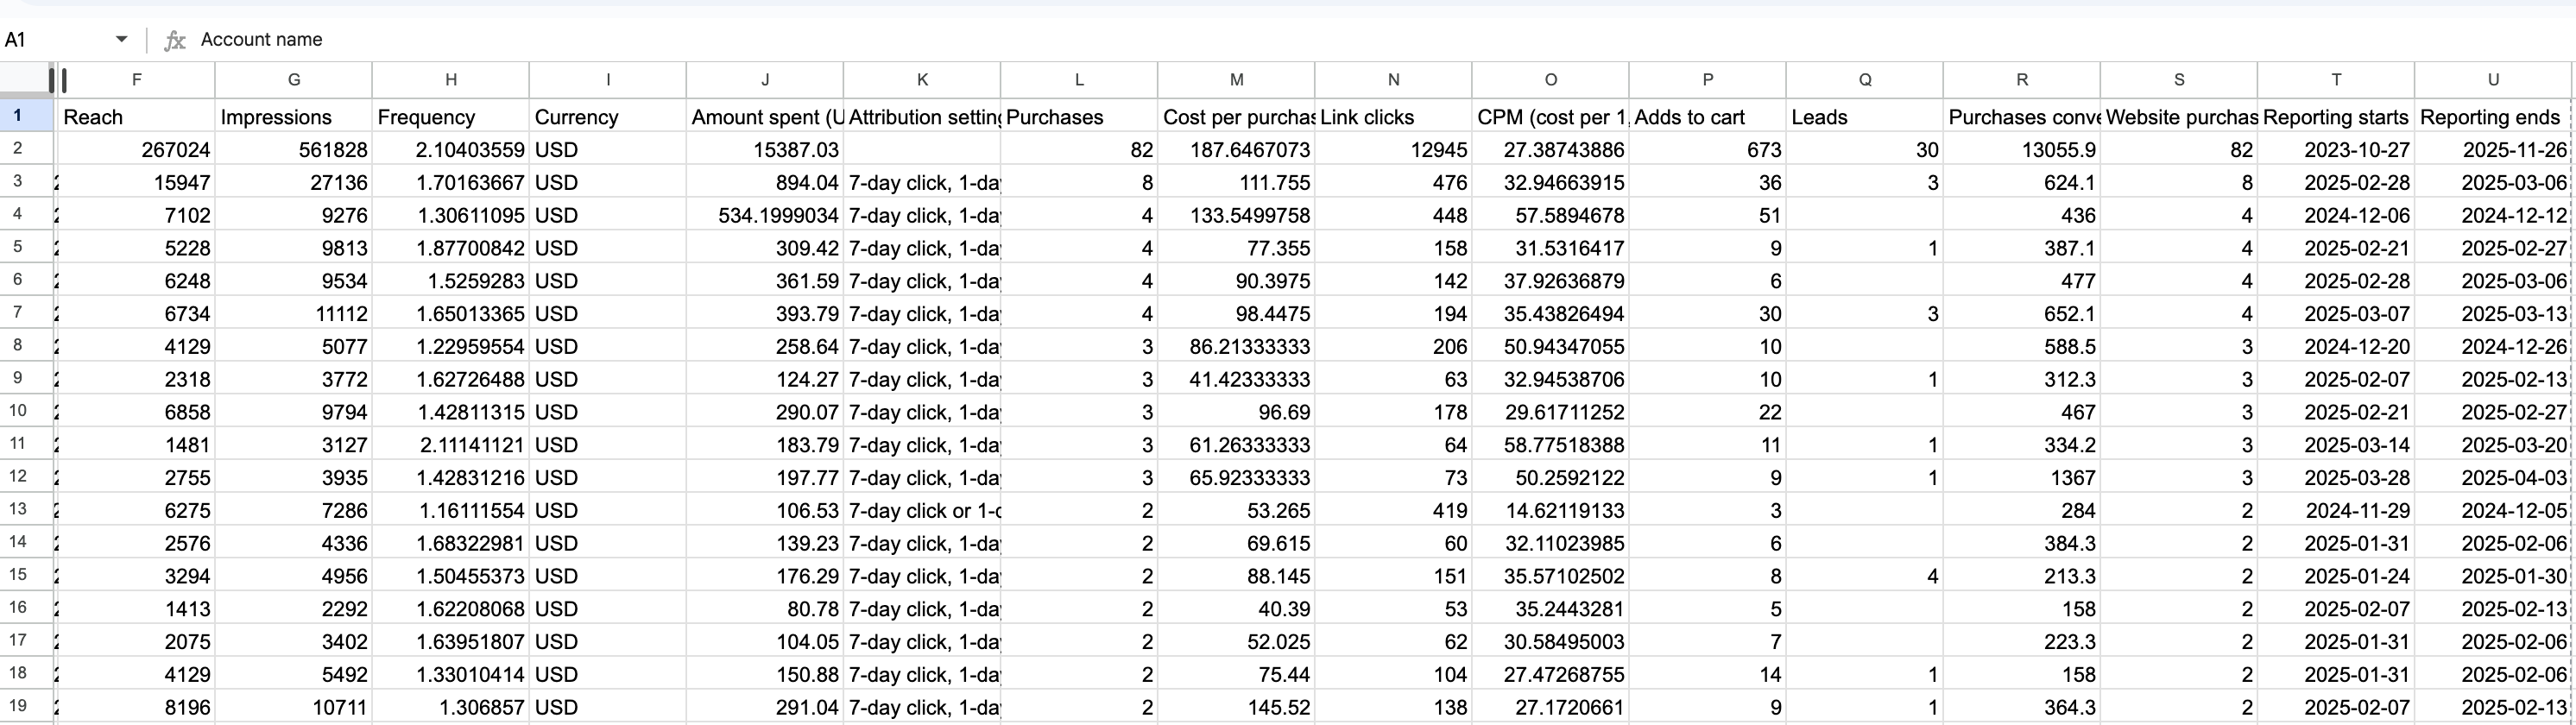
The Performance Table – everything about what the asset did
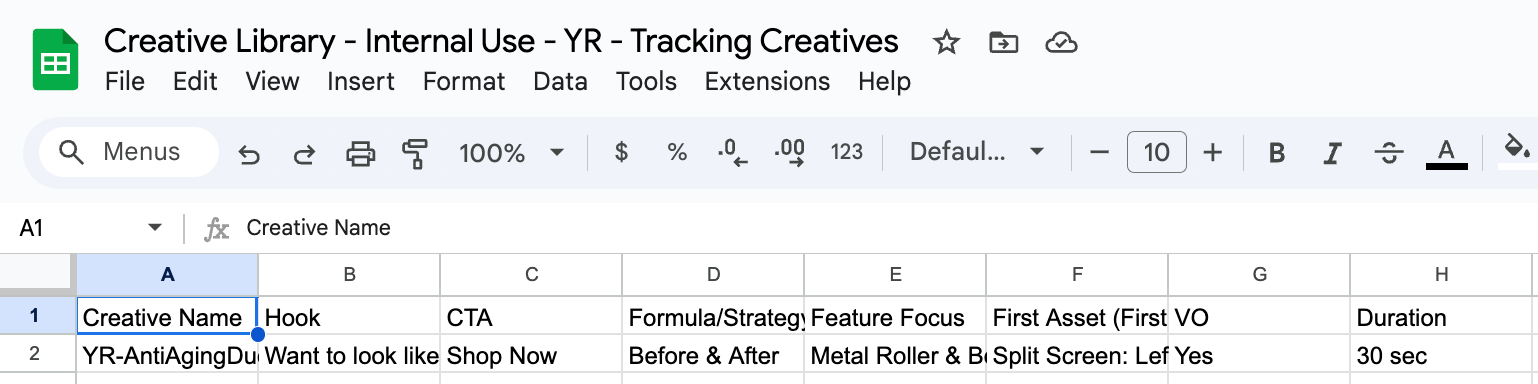
In the creative table, we track things like:
What it’s about (offer, product, vertical)
How it shows up (format, style, creator type)
How it starts (the first few seconds, the hook)
Where it lives (channel, market, language, campaign)
Not in paragraphs.
Not in notes.
In cells.
In the performance table, we don’t overthink it:
Spend, impressions, CTR, CVR, CPA, ROAS, view rates, etc.
One row per ad / asset export from each platform
Then we connect the two tables with a shared ID or filename.
Suddenly:
That “nice video from the Black Friday push”
Becomes
“Row 438 that opened with a problem dramatization, ran to creators in the US, and hit a 3.4x ROAS.”
Once it’s a row, it’s no longer anecdotal.
It’s queryable.
Why We’re Obsessed With the First Few Seconds
One of the most important columns in our creative table is simply:
“What happens in the first few seconds?”
Because in paid social, those seconds decide if your ad even gets a chance to perform.
So we tag that moment consistently:
Is it a before/after?
A bold claim?
A weird visual?
A problem dramatization?
A question straight to camera?
Not with fancy language.
With simple, repeatable labels we can filter later.
Now we can ask:
“For this vertical, which type of intro gives us the best CTR?”
“When we open with a weird visual vs. a straightforward product shot, what happens to CPA?”
You can’t get that answer from a folder name.
You get it from a pivot table.
Hooks, Verticals, Campaigns: The Tags That Pay Rent
There are three categories we tag religiously:
Verticals – Who is this really for?
Students, creators, beauty lovers, founders, parents…
We pick one primary vertical instead of pretending “this ad is for everyone.”
Hooks – What’s the first promise / tension?
Every hook gets a short description and an internal code.
The same hook can show up in different edits and formats, but it’s still the same idea.
Campaigns – What initiative did this belong to?
One campaign → many creatives → one column to tie them all together.
Once those tags live in the table, we can do things like:
Compare hooks inside the same campaign
Compare verticals across the same hook
See which campaigns relied on “one lucky creative” vs. a broader bench of winners
That’s how you graduate from “cool, that ad worked” to “we understand why it worked.”
From Guessing to Analysis: How the Tables Actually Get Used
The magic is not in having tables.
The magic is in running the same analyses over and over.
Here are a few flows we keep coming back to at Marketing Vandals:
“Top Hooks This Quarter” Table
Filter by date range
Group by hook
Look at ROAS / CPA / spend per hook
Result: a ranked list of ideas, not just videos
“Vertical vs. Intro Type” Table
Rows = verticals
Columns = intro types (bold claim, problem, weird visual, etc.)
Cells = CTR / ROAS averages
Result: a cheat sheet for which openings to use for which audience.
“Format & Channel Sanity Check” Table
Compare performance of the same idea across formats and placements
Result: clarity on when to invest in extra edits vs. when one format is enough.
“Workhorse Assets” View
Filter for creatives that ran in multiple campaigns and still hit target KPIs
Result: the short list of assets to repurpose, reshoot, or localize.
Every new brief starts here.
Not in Figma.
Not in a brainstorm.
In the tables.
Stop Working in the Dark
Most teams think they have a creative problem.
What they really have is a data structure problem.
If your media library is just:
A pile of exports
Organized in pretty folders
Remembered by “vibes” and Slack links
…then every new campaign is guesswork with extra steps.
Marketing Vandals runs differently:
We shoot.
We tag.
We export performance.
We join the tables.
We learn.
Then we brief the next wave based on what the tables told us.
No one remembers which video “felt good.”
We remember which patterns won.
Because once your creatives live as rows in a table, you’re not just making ads anymore.
You’re running a creative analytics engine—and turning chaos into a compounding advantage.